Topic: Data Organization Plot And Interpretation
Data Organization Plot And Interpretation
The graph below shows the results of an action of the enzyme catalase on a piece of meat. Evidence of enzyme activity is indicated by bubbles of oxygen.

Which statement best summarizes the activity of catalase shown in the graph?
(1) The enzyme works better at 10°C than at 50°C.
(2) The enzyme works better at 5°C than at 65°C.
(3) The enzyme works better at 35°C than at either temperature extreme.
(4) The enzyme works at the same level in all environments.
An experiment was carried out to answer the question “Does the pH of water affect the growth of radish plants?” Two groups of ten radish plants were set up. One group was watered with water having a pH of 3.0, and the other group was watered with water having a pH of 7.0. Both groups of plants received the same amount and intensity of light, the same amount of water, and they were grown in the same type of soil. The heights of the radish plants were measured every 2 days for a period of 2 weeks.
What was the dependent variable in this experiment?
(1) heights of the plants
(2) pH of the water
(3) temperature of the water
(4) type of soil
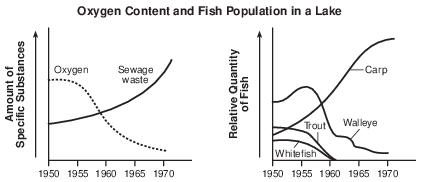
Which inference can be made from the graphs?
(1) The increase in sewage waste from 1950 to 1970 was due to a decreasing human population.
(2) The decrease in sewage waste shows that the environmental problems associated with land pollution have been solved.
(3) Sewage waste is a good source of nutrients for most fish.
(4) Increases in sewage waste were responsible for decreasing oxygen levels in the lake.
During certain times of the year, bears feed heavily on a population of fish in a lake. At other times of the year, the bear population feeds primarily on fruits, berries, and insects.

During which month would the bears in the area have the most fish available?
(1) May
(2) July
(3) August
(4) October
The chart below shows the number of differences in genetic material between individuals within the same species. Scientists can use this information to determine which populations demonstrate the greatest amount of genetic diversity.
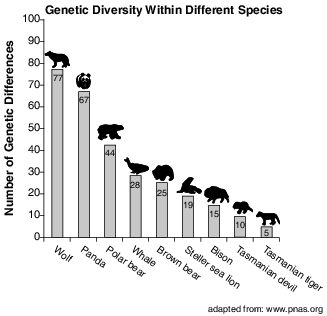
According to the chart, which two species would be more likely to survive if their environmental conditions changed?
(1) Tasmanian tiger and Tasmanian devil
(2) brown bear and whale
(3) Tasmanian tiger and wolf
(4) panda and wolf
Illinois Greater Prairie Chicken on the Rise
As pioneers moved west in the mid-1800s, the greater prairie chicken population in Illinois was estimated to number in the millions. Since then, their population has drastically declined.
Evidence of the rapidly declining population was obtained from studying the number of eggs that hatched over several years. In Jasper County, Illinois, the number of prairie chickens fell from 2,000 to less than 50 in under 35 years. Researchers compared the DNA from feather samples from the living Illinois chickens to the DNA from feather samples dating from the year 1930 found in a museum. It was found that the living Illinois chicken population had a very low level of genetic diversity.
In 1992, researchers attempted to increase genetic variation by transporting more than 500 healthy prairie chickens into Illinois from the states of Minnesota, Kansas, and Nebraska. The data table below shows the changes in the percent of eggs that hatched from samples taken in different years. Researchers documented that this increase in the percent of eggs that hatched was not influenced by environmental events.
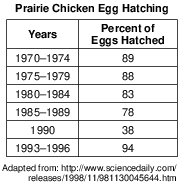
Directions: Using the information given, construct a bar graph on the grid following the directions below.
Label the y-axis on the line provided. [1]
Allow 1 credit for correctly labeling the y-axis “Percent of Eggs Hatched.”
• Note: Do not allow credit if percent or % is not included in the label.
Moose-killing Winter Ticks
Moose habitat is determined by temperature. Moose prefer areas where the average summer temperature is around 15°C and does not exceed 27°C for too long. The reason for this temperature dependency: Moose cannot sweat.
Besides the cooling effect of water, which moose are almost always near, aquatic environments provide them with a good supply of food, and in the past, have protected them against biting insects. However, the North American moose population is facing a new threat: a parasite called the winter tick. These ticks lodge themselves in the animal’s fur and hold on through the winter, sucking the animal’s blood. Many infected moose end up dying of exhaustion and weakness as a result of the large number of ticks feeding on them.
Ticks are most active during dry days in the fall. Adult ticks that drop off moose in the spring and land on snow cover have a poorer survival rate. Climate change can be predicted to improve conditions for winter ticks due to longer and warmer falls, and earlier snowmelt in the spring.
Surveys of the moose population in northeastern Minnesota have recorded the change shown below in the moose population between 2005 and 2013.
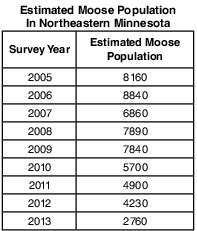
Directions: Using the information in the data table, construct a line graph on the grid below, following the directions below.
Mark an appropriate scale, without any breaks in the data, on the axis labeled “Estimated Moose
Population.” [1]
Allow 1 credit for completing an appropriate scale, without any breaks in the data, on the axis
• labeled “Estimated Moose Population.”
Five groups of corn seeds, each containing 275 seeds, were soaked for 1 hour in different concentrations of gibberellic acid, a plant growth hormone. After 1 hour, the seeds were rinsed in tap water and drained of all excess water. The seeds were then placed on paper towels and kept moist for 7 days. After 7 days, the growing stems were cut and weighed to determine the increase in growth. Then, the percent increase in growth compared to the growth of a group of untreated seeds was calculated. The results were recorded and are shown in the data table below.
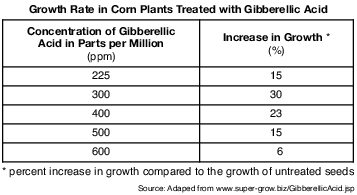
Directions: Using the information given in the data table, construct a line graph on the grid, following the directions below.
Mark an appropriate scale, without any breaks, on each labeled axis on the grid on the next page. [1]
Allow 1 credit for marking an appropriate scale, without any breaks in the data range, on each
• labeled axis.
White Nose Syndrome Found in Bats
White nose syndrome (WNS) is a disease found in bats. The disease, first detected in bats during the winter of 2006, is characterized by the appearance of a white fungus on the nose, skin, and wings of some bats, which live in and around caves and mines. It affects the cycle of hibernation and is responsible for the deaths of large numbers of bats of certain species. In some areas, 80-90% of bats have died. Not all bats in an area are affected, and certain bats that are susceptible in one area are not affected in other areas.
The roles of temperature and humidity in the environment of the bats are two of the many factors being investigated to help control the disease. Over the past few years, the Conserve Wildlife Foundation of New Jersey conducted summer bat counts of two bat species at 22 different sites, totaled the number, and reported the results. The approximate numbers of bats counted (to the nearest hundred) are listed in the table below.

Directions: Using the information in the data table, construct a line graph on the grid on the next page, following the directions below.
Mark an appropriate scale, without any breaks in the data, on the axis labeled “Number of Bats.” [1]
Allow 1 credit for marking an appropriate scale, without any breaks in the data, on the axis labeled
• “Number of Bats.”
• Note: Do not allow credit if the grid is extended to accommodate the scale.
Peregrine falcons are an endangered species in New York State. This crow-sized predator feeds primarily on birds. Starting in the 1940s, exposure to the pesticide DDT in their prey caused declines in the peregrine falcon population. These pesticides caused eggshell thinning, which drastically lowered breeding success. By the early 1960s, peregrine falcons no longer nested in New York State. After the United States banned DDT in 1972, efforts were made to reintroduce peregrine falcons into the Northeast. Since the 1980s, the peregrine falcons are once again breeding in many areas of New York State.
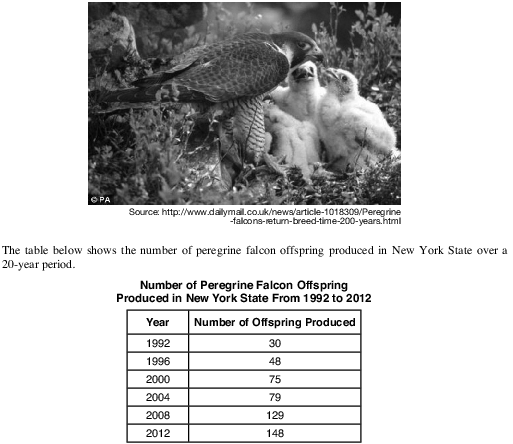
Directions: Using the information in the data table, construct a line graph on the grid provided, following the directions below.
Mark an appropriate scale, without any breaks in the data, on each labeled axis. [1]
Allow 1 credit for marking an appropriate scale on the grid provided, without any breaks in the
• data, on each labeled axis.
• Note: Do not allow credit if the grid is altered to accommodate the scale.
Two species of finches found on a particular Galapagos island eat the seeds of a certain variety of plant. The relative strength of their beaks is shown in the graph below.
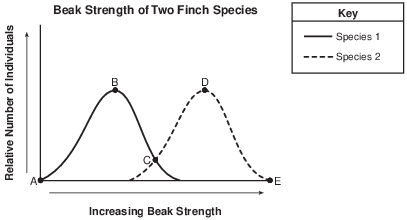
Select the point on the graph where beak strength of the two bird species is equal. Support your answer. [1]
Point: _______
Allow 1 credit for C and supporting the answer. Acceptable responses include, but are not limited to:
• — At point C, the beak strength has the same value for both species.
• — because that is where the lines intersect
Diabetes is a disease characterized by consistently high blood glucose levels (at or above 126 mg/100 mL) as a result of hormone deficiency. For a study of diabetes, blood glucose levels from individual A and individual B were recorded each hour over a 5-hour period following a meal. The results are shown in the data table below.
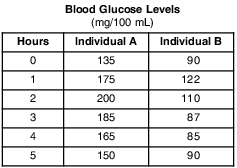
Directions: Using the information in the data table, construct a line graph on the grid on the next page, following the directions below.
Mark an appropriate scale, without any breaks, on each labeled axis. [1]
Allow 1 credit for marking an appropriate scale, without any breaks, on each labeled axis.
In order to determine the effect of a certain antibiotic on a species of microorganism, an investigation was carried out. A sample of a specific species of microorganism was added to 100 mL of a liquid culture medium. One mL of a solution of the antibiotic was then added to that culture medium. Each day at 10 a.m., 1 mL of the experimental culture medium was removed and the number of microorganisms in the 1-mL sample was determined. The 1 mL of experimental culture medium was replaced by 1 mL of new sterile culture medium to maintain a constant volume. The results are shown in the table below.

Directions: Using the information in the data table, construct a line graph on the grid, following the directions below.
Mark an appropriate scale, without any breaks, on each labeled axis. [1]
Allow 1 credit for marking an appropriate scale, without any breaks, on each labeled axis.
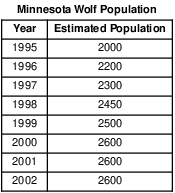
Directions: Using the information in the data table, construct a line graph on the grid, following the directions below.
Label the y-axis on the line provided. [1]
Allow 1 credit for correctly labeling the y-axis.
Onondaga Lake is a small lake located near Syracuse, New York. Industrialized municipal wastes have been polluting the lake for decades. Eating fish from the lake has been banned due to mercury concentrations in the fish. The data table below indicates the mercury concentrations in smallmouth bass taken from Onondaga Lake. Smallmouth bass eat smaller fish, which feed on aquatic plants.
At each feeding level in the food chain, more mercury accumulates. The older and larger the fish, the greater the concentration of mercury.

Directions: Using the information in the data table, construct a line graph on the grid below, following the directions below.
Mark an appropriate scale, without any breaks in the data, on each labeled axis. [1]
Allow 1 credit for marking an appropriate scale, without any breaks in the data, on each labeled axis.
